The values calculated here are derivatives from data in the individual photos. Specifically, the distance and time between images is calculated here.
The distance and time lapse between photos will be used later to do things like group the images.
Show the code
## Standard Packageslibrary(devtools) ## Load github packageslibrary(tidyverse) ## Many useful functionslibrary(ggplot2) ## Graphics functionslibrary(dplyr) ## Data crunching functionslibrary(lubridate) ## Time functionslibrary(gt) ## Tables## Specialized Packageslibrary(geosphere) ## Geographic calculations## Packages from github/kimbridges## install_github("kimbridges/milestones")library(milestones) ## Milestones and Bar-timelines## Initialize defaultscolumn <-lolli_styles()## Get Baseinfo (originates in photos chapter)baseinfo <-read.table("baseinfo.txt")source <- baseinfo$sourcefolder <- baseinfo$folderthumbs_folder <- baseinfo$thumbs_folderfiles_folder <- baseinfo$files_folder
2.1 Calculate Distances & Times
Here is where the main calculations are done. There aren’t any surprises here. The distances are calculated from the latitude and longitudes. They are “straight line” distances, not driving distances.
Show the code
## Get the stored table_infofile_location <-paste0(files_folder,"/photo_info.txt")data <-read.table(file = file_location)## Get the distances between photosdata$dist_meters[1] <-0.0for(i in2:nrow(data)){## Isolate the origin & destination. origin <-c(data$lon[i-1],data$lat[i-1]) destination <-c(data$lon[i],data$lat[i])## Calculate the distance. distance <-distm(origin, destination, fun=distHaversine)## Save the distance. data$dist_meters[i] <-round(distance,digits =1)## Convert meter to miles.## dist_miles <- distance * 0.000621371## data$dist_miles[[i]] <- round(dist_miles,digits = 0) } ## end for loop## Get the time between photosdata$timespan[i] <-0.0for(i in2:nrow(data)){## Isolate the previous & current times. previous_time <- (paste0(data$time[i-1],":00")) current_time <- (paste0(data$time[i],":00")) span <-parse_date_time(previous_time, "%T") %--%parse_date_time(current_time, "%T")## Save the interval. data$timespan[i] <-round(span/60,digits =1) } ## end for looptable3 <- data |>select(number,time,dist_meters,timespan)gt(table3)
number
time
dist_meters
timespan
1
9:40
0.0
NA
2
11:57
88120.6
137
3
12:19
8472.4
22
4
12:40
991.8
21
5
12:55
60.6
15
6
15:15
447.5
140
7
15:18
18.6
3
8
15:46
18.8
28
9
16:10
28.7
24
10
16:12
74.3
2
11
16:26
301.2
14
12
17:32
851.8
66
13
17:45
0.2
13
14
18:25
1.2
40
15
19:36
0.4
71
16
19:49
20.6
13
Show the code
## Save the updated data.file_location <-paste0(files_folder,"/photo_info.txt")write.table(data, file = file_location)
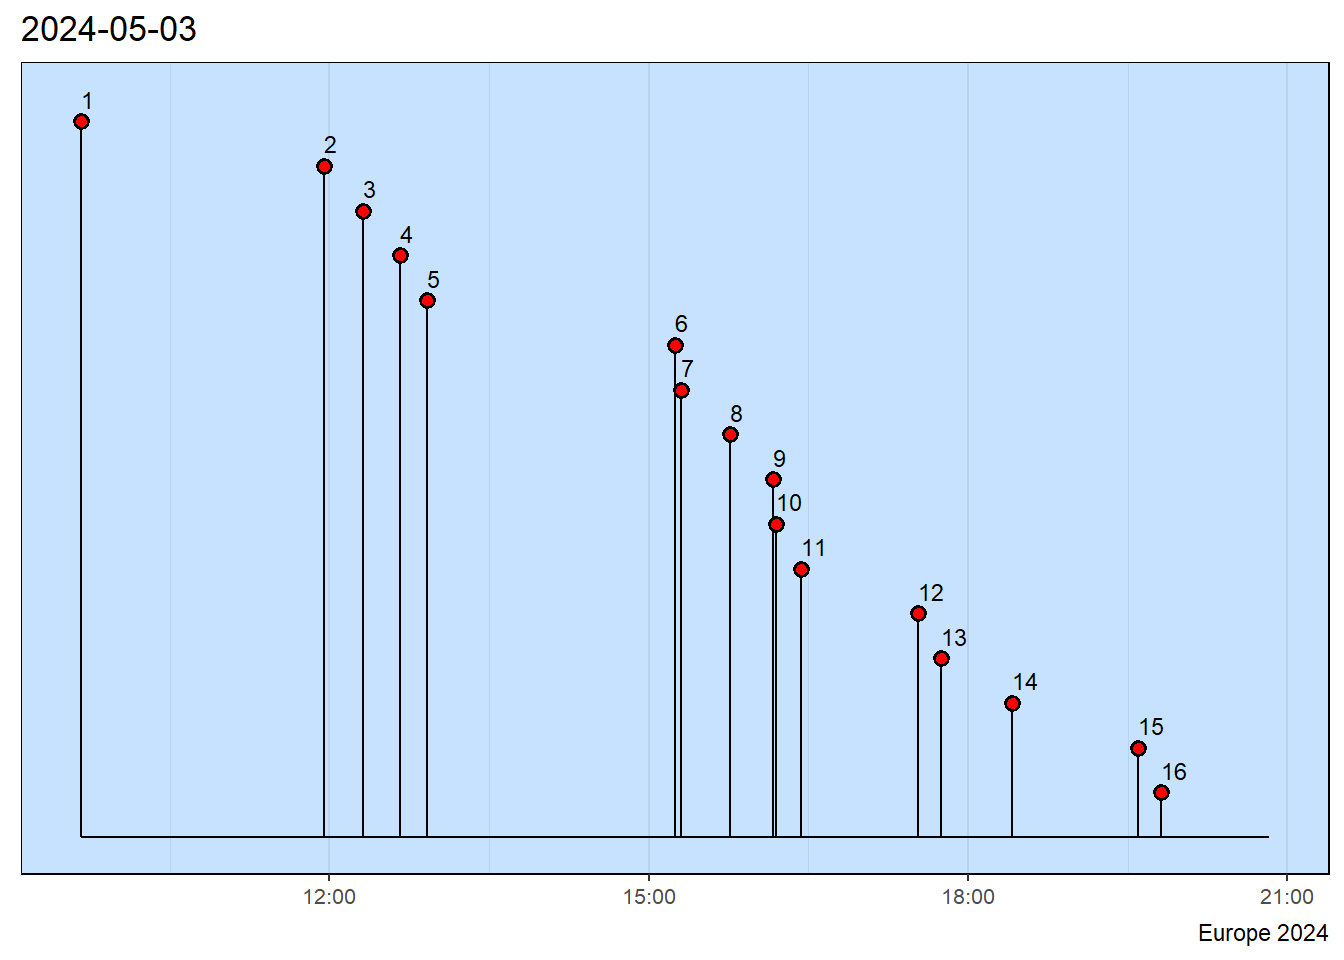
2.2 Show Photo Times
A milestone chart shows when during the day each of the photos was taken. This might give some insight into whether parts of the day were missed, if there is excessive clumping of the photos and other things that might need attention.
Show the code
## Get the information.file_location <-paste0(files_folder,"/photo_info.txt")data <-read.table(file = file_location)## Get the date.photodate <- data$date[1]## Make the data table for milestones.data$datetime =paste(data$date,data$time) ## Build the full date + time variable.data$newdate <-parse_date_time(data$datetime, "ymd HM", tz="")## Configure a data subset with proper variable names.data <- data |>rename(event = number) |>select(event, newdate) |>rename(date = newdate)## Make a confirmation table.gt(data) |>tab_source_note(source_note=source)
event
date
1
2024-05-03 09:40:00
2
2024-05-03 11:57:00
3
2024-05-03 12:19:00
4
2024-05-03 12:40:00
5
2024-05-03 12:55:00
6
2024-05-03 15:15:00
7
2024-05-03 15:18:00
8
2024-05-03 15:46:00
9
2024-05-03 16:10:00
10
2024-05-03 16:12:00
11
2024-05-03 16:26:00
12
2024-05-03 17:32:00
13
2024-05-03 17:45:00
14
2024-05-03 18:25:00
15
2024-05-03 19:36:00
16
2024-05-03 19:49:00
Europe 2024
Show the code
## Add source info to the milestones chart.column$source_info <- sourcecolumn$title <- photodate## Make a milestones chart.milestones(datatable = data, styles = column)