Pedigree diagrams show family relationships. The arrangement usually follows some simple conventions. Older people are toward the top of the diagram. Individuals from the same generation are on the same row. Gender is usually shown as either a square symbol (male) or circular symbol (female).
Building a pedigree diagram is a convenient way to store information about family structures. This may be your own family, your friends and acquaintances, or people you’re studying.
First, we’ll get some libraries initialized.
Show the code
## Activate the Core Packageslibrary(tidyverse) ## Brings in a core of useful functionslibrary(gt) ## Tables## special librarieslibrary(kinship2) ## Core package to calculate and plotlibrary(R.devices) ## External plot files (e.g., PNG)library(tinypedigree) ## For the tiny_pedigree function
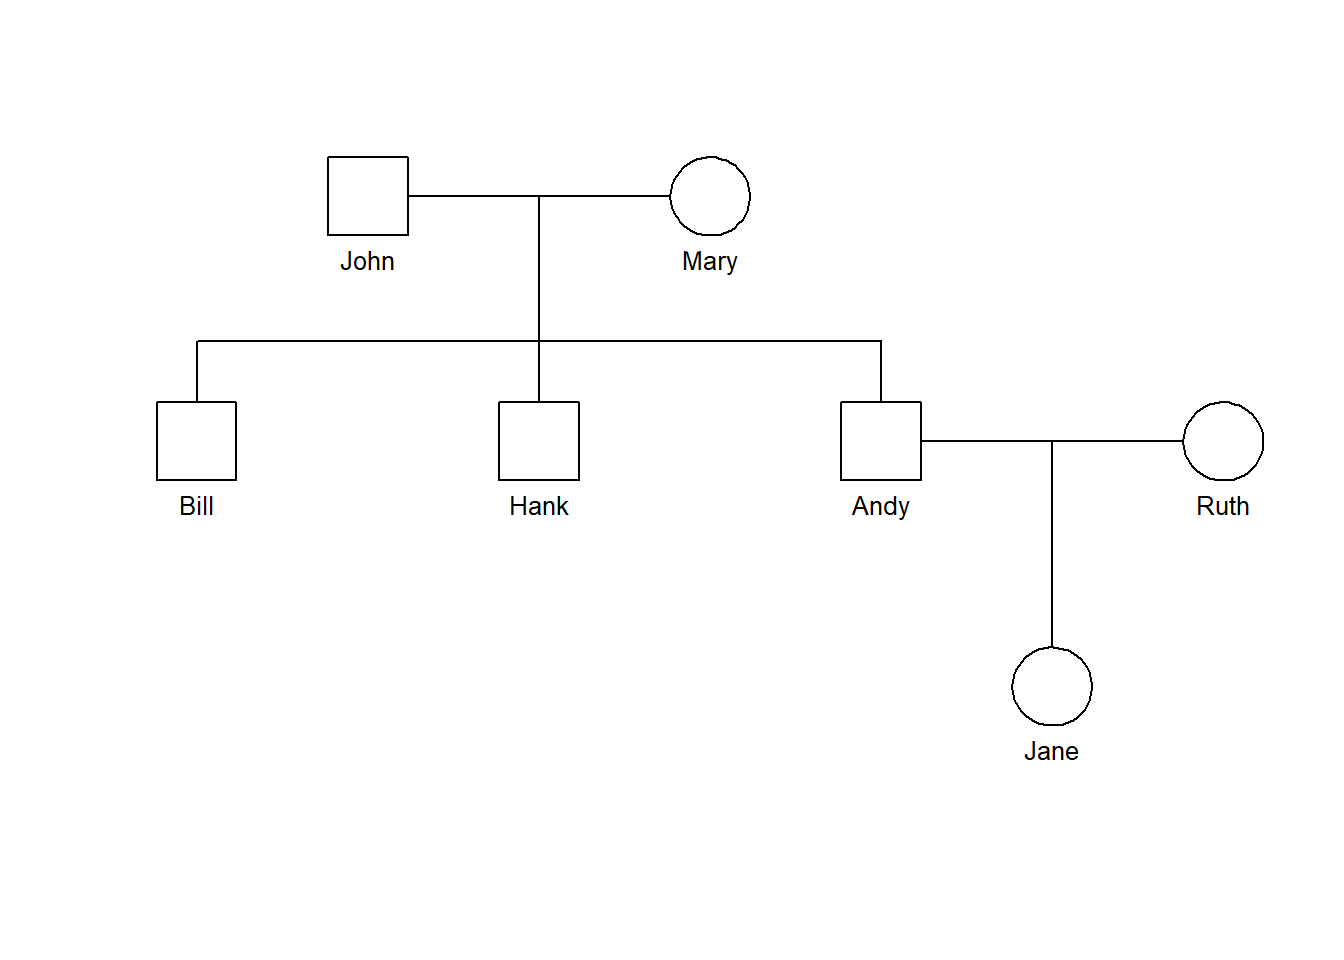
You start with a table. This lists each individual and their parents. You also need the gender of each person. There is one row for each individual. Pedigree diagrams are constructed automatically from data in the table. The data are built up from linkages between children and their parents.
Show the code
## Create the main data tabledata <-read_csv(col_names =TRUE, show_col_types=FALSE, file="ID, dad, mom, gender John, NA, NA, male Mary, NA, NA, female Bill, John, Mary, male Hank, John, Mary, male Andy, John, Mary, male Ruth, NA, NA, female Jane, Andy, Ruth, female")## Print a table gt(data) |>tab_source_note(source_note="Source: Demonstration data")
ID
dad
mom
gender
John
NA
NA
male
Mary
NA
NA
female
Bill
John
Mary
male
Hank
John
Mary
male
Andy
John
Mary
male
Ruth
NA
NA
female
Jane
Andy
Ruth
female
Source: Demonstration data
Show the code
## Generate the pedigree diagramtiny_pedigree(data=data)
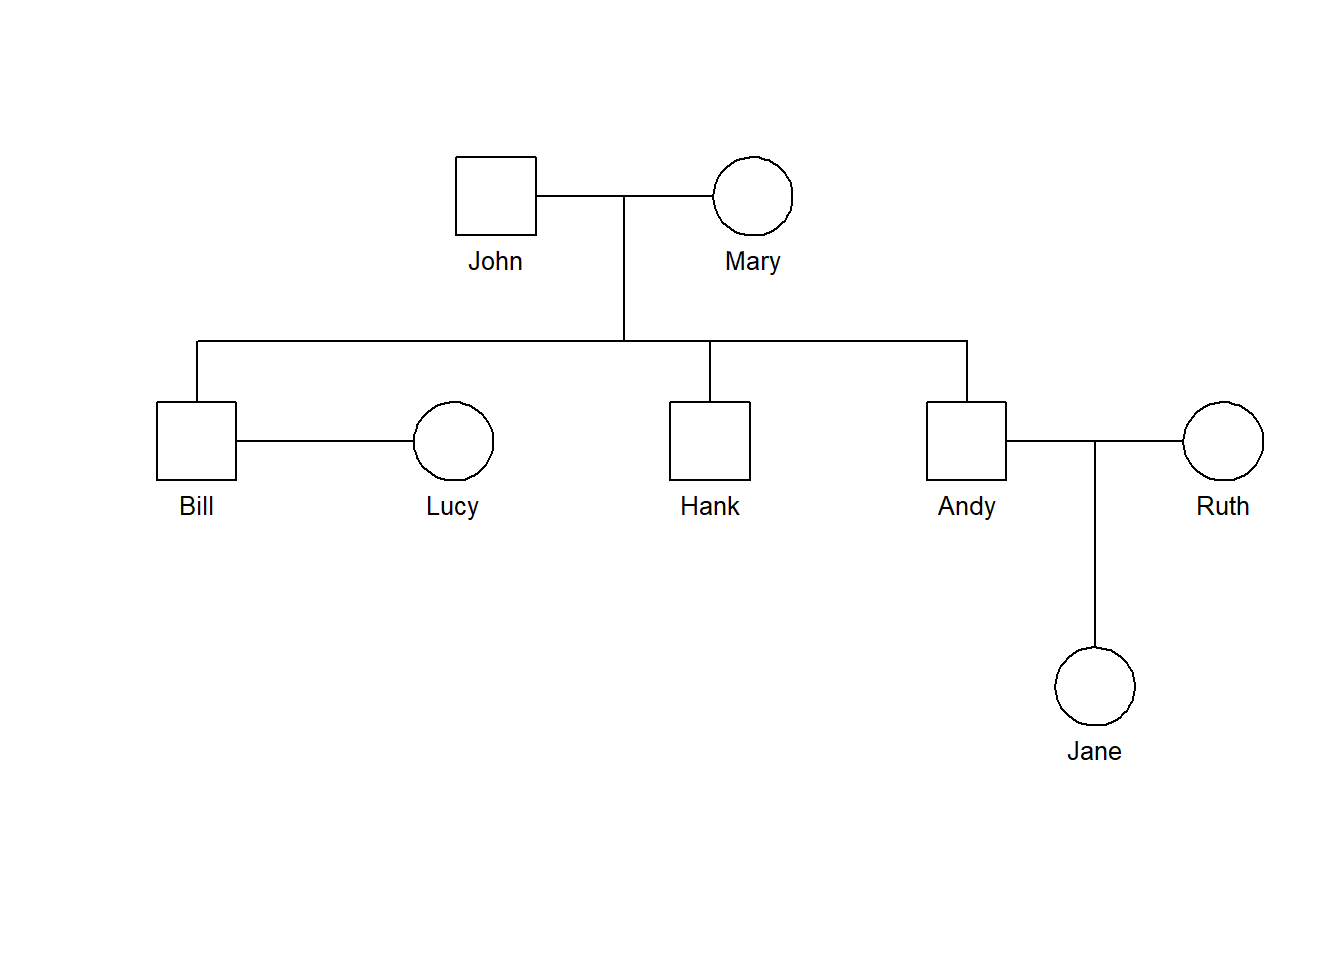
In some situations, individuals listed in the data table have no children. As a result, these people can’t be linked into the rest of the table without some additional information. This requires a second table that lists two people in the original data table who should be linked. Note that everyone needs to be listed as a row in the main data table.
If you have a situation where an individual listed in the main data table is not linked by their children, this person is not plotted in the pedigree diagram.
Show the code
## Create the main data tabledata <-read_csv(col_names =TRUE, show_col_types=FALSE, file="ID, dad, mom, gender John, NA, NA, male Mary, NA, NA, female Bill, John, Mary, male Hank, John, Mary, male Andy, John, Mary, male Ruth, NA, NA, female Jane, Andy, Ruth, female Lucy, NA, NA, female")## Print a table gt(data) |>tab_source_note(source_note="Source: Demonstration data")
ID
dad
mom
gender
John
NA
NA
male
Mary
NA
NA
female
Bill
John
Mary
male
Hank
John
Mary
male
Andy
John
Mary
male
Ruth
NA
NA
female
Jane
Andy
Ruth
female
Lucy
NA
NA
female
Source: Demonstration data
Show the code
## Generate the pedigree diagramtiny_pedigree(data=data)
Did not plot the following people: Lucy
Woops. The code chunk probably didn’t run quite as expected. There is a “missing” person (“Lucy” in this example).
Married individuals without children: The “missing” person is added with an additional table. Here (and in the other examples), this table is called “links.” There are two ID columns for the ID values (from the main data table) of the two people to be linked. Note that these are married people who have no children. The need for this links table is logical as the primary use of a pedigree diagram is to show the relationships of offspring to their predecessors. In that use, a couple without children has no value and, therefore, wouldn’t be shown. As we are interested in family structure, we need to add this kind of link.
Creating links between the two married individuals is shown in the next example by using data from the previous chunk. Note that the order of the people in a link doesn’t matter. You can have two or more childless couples in this table. The order of the couples doesn’t matter, either.
Show the code
## Link married people who don't have childrenlinks <-read_csv(col_names=TRUE, show_col_type=FALSE, file="id1, id2 Lucy, Bill")## Generate the pedigree diagramtiny_pedigree(data=data, links=links)
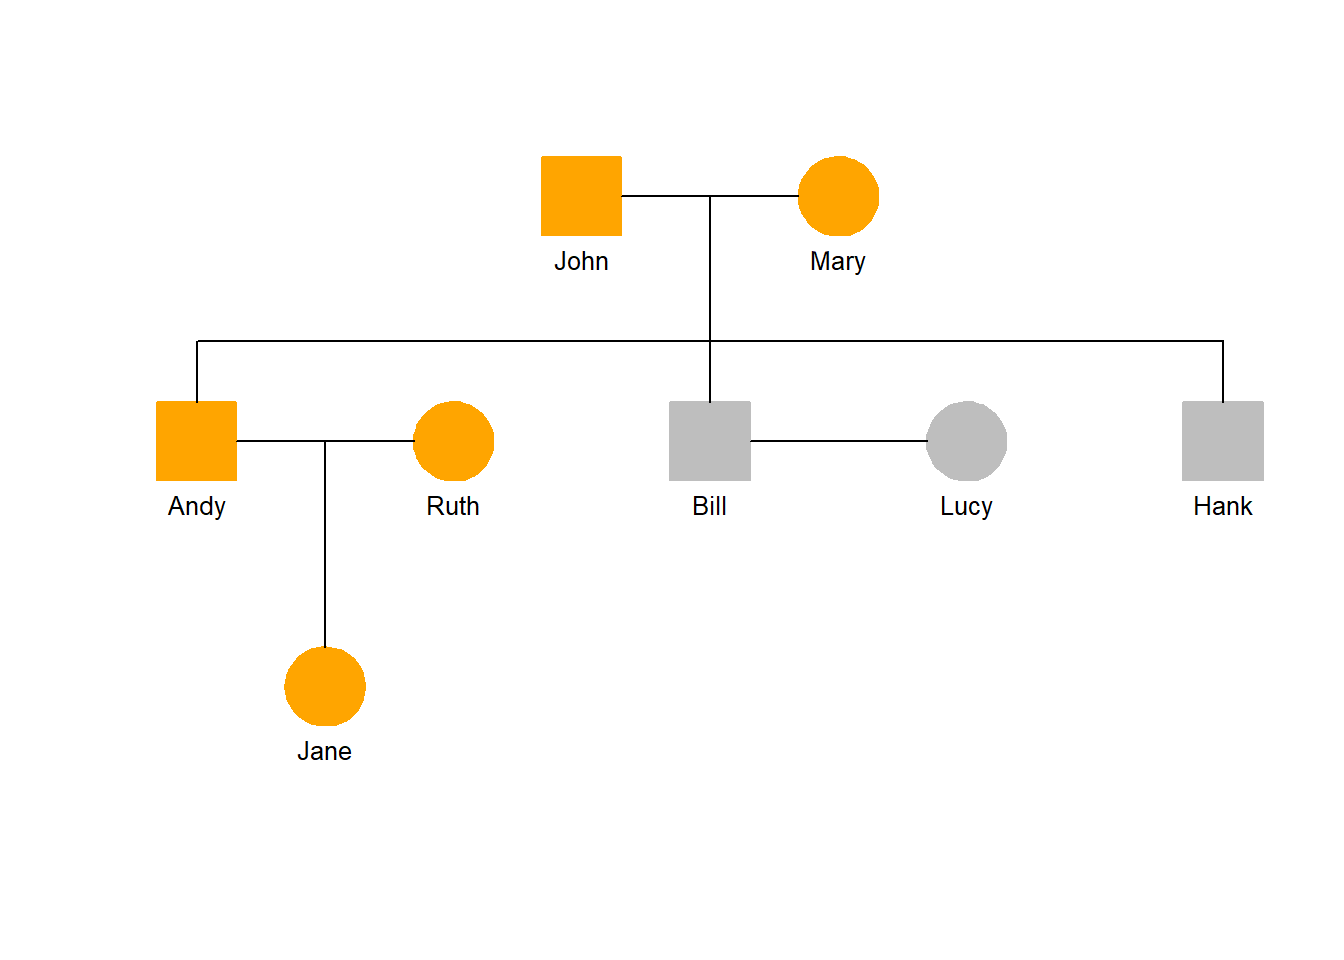
Tables are useful in their own right as you can store information about individuals besides their parentage. Birth and death dates are an obvious type of supplemental data. But you’re not limited to demographic information.
In the following example, additional information is added to each individual. The original data are then merged with this new set.
A column (color) is used to highlight all individuals who play a stringed instrument.
The table produced from the merged data doesn’t show all the columns. In this case, the dad and mom columns, which are required for construction of the pedigree, do not need to be shown in this more general summary of the individuals.
All the NA values are converted to blank cells in the table. This is useful so the NA values don’t distract from the more informative data.
Show the code
## The master data table from the previous chunks is used here## New information for the data tablenew <-read_csv(col_names =TRUE, show_col_types=FALSE, file="ID, born, died, instrument, color John, 1905, 1978, violin, orange Mary, 1907, 1982, viola, orange Bill, 1928, 1997, NA, gray Hank, 1930, 1943, NA, gray Andy, 1932, 2010, violin, orange Ruth, 1934, 2019, harp, orange Jane, 1958, NA, violin, orange Lucy, 1930, 2005, NA, gray")## Merge the datadata <-merge(data, new, by="ID")## Build a tablegt(data) |>cols_hide(columns=c(dad, mom, color)) |>sub_missing(missing_text ="") |>tab_source_note(source_note="Source: Demonstration data")
ID
gender
born
died
instrument
Andy
male
1932
2010
violin
Bill
male
1928
1997
Hank
male
1930
1943
Jane
female
1958
violin
John
male
1905
1978
violin
Lucy
female
1930
2005
Mary
female
1907
1982
viola
Ruth
female
1934
2019
harp
Source: Demonstration data
Show the code
## Add a hilite column so colors will fill symbolsdata$hilite <-TRUE## Generate the pedigreetiny_pedigree(data=data, links=links)
Note that the color column is used automatically in the pedigree diagram. This is just one of the enhancements possible to make the pedigree diagram a useful visual tool.