A theme lets you control many of the visual properties of a map (or other ggplot graphic). This includes the background and bounding-box characteristics. Do you want to show the latitude and longitude on the axes? This is controlled by a theme.
3.1 Two Special Themes
Two themes are available in the plainmaps package.
plain_background_theme: This theme blanks out anything that is outside the map’s border. There are no axes (i.e., bounding box) drawn. The background has no grid lines or color.
island_map_theme: This theme works for islands. The is a bounding box drawn but there is no axis annotation (i.e., no latitude or longitude markings). The background, by default, is colored a shade of blue to represent the ocean.
Other visual aspects of the maps can be controlled by an ad hoc use of the theme properties of ggplot.
3.2 Initialize the Libraries and Data
Show the code
## Set an option for the read_csv functionoptions(readr.show_col_types =FALSE) ## Suppress warning msg## Initialize the Standard Librarieslibrary(readr)library(ggplot2)library(dplyr)library(gt)## Initialize sitemaps & plainmapslibrary(sitemaps)library(plainmaps)## Map Librarieslibrary(mapdata)library(sf)## Initialize for Sitemapscolumn <-site_styles()hide <-site_google_hides()## Themesplain_background_theme <-theme(panel.border =element_blank(), panel.grid =element_blank(),panel.background =element_blank(),axis.text =element_blank(),axis.ticks =element_blank(),axis.title =element_blank()) island_map_theme <-theme(panel.border =element_rect(color ="black", fill =NA, linewidth =0.7), panel.grid =element_blank(),panel.background =element_rect(fill ="lightsteelblue1"),axis.text =element_blank(), axis.ticks =element_blank(), axis.title =element_blank())## This theme removes the axis labels and ## puts a border around the map. No legend.simple_black_box <-theme_void() +theme(panel.border =element_rect(color ="black", fill=NA, size=2),legend.position ="none")
3.3 Control the Appearance of the Map Background
Themes control the appearance of background elements.
In the next few examples, the special themes will be demonstrated.
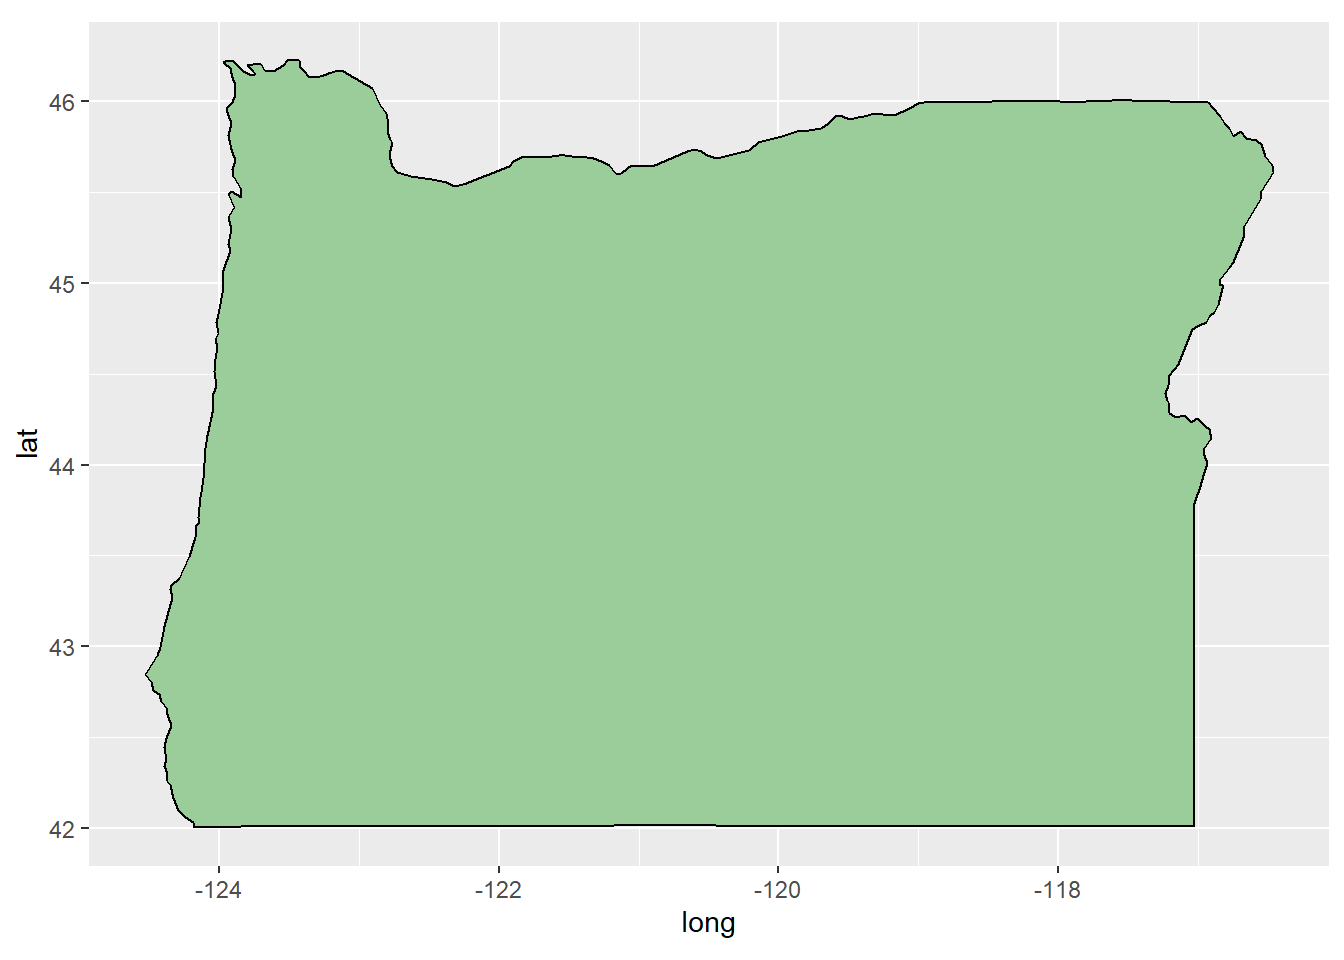
This example shows a map that doesn’t use any special theme. Note that there are grid line, axis values and axis labels.
Show the code
## Load the state outlines. states <-map_data("state") ## Extract OregonOR <- states %>%filter(region =="oregon") ## Create the map. OR_map <-ggplot(data = OR, mapping=aes(x = long, y = lat, group = group)) +## Draw and fill the state outlinegeom_polygon(fill ="darkseagreen3",color ="black") +## Adjust for lat/lon distortioncoord_fixed(1.3)## Plot the map without the plain_background_theme.OR_map
3.4 Use the plain_background_theme
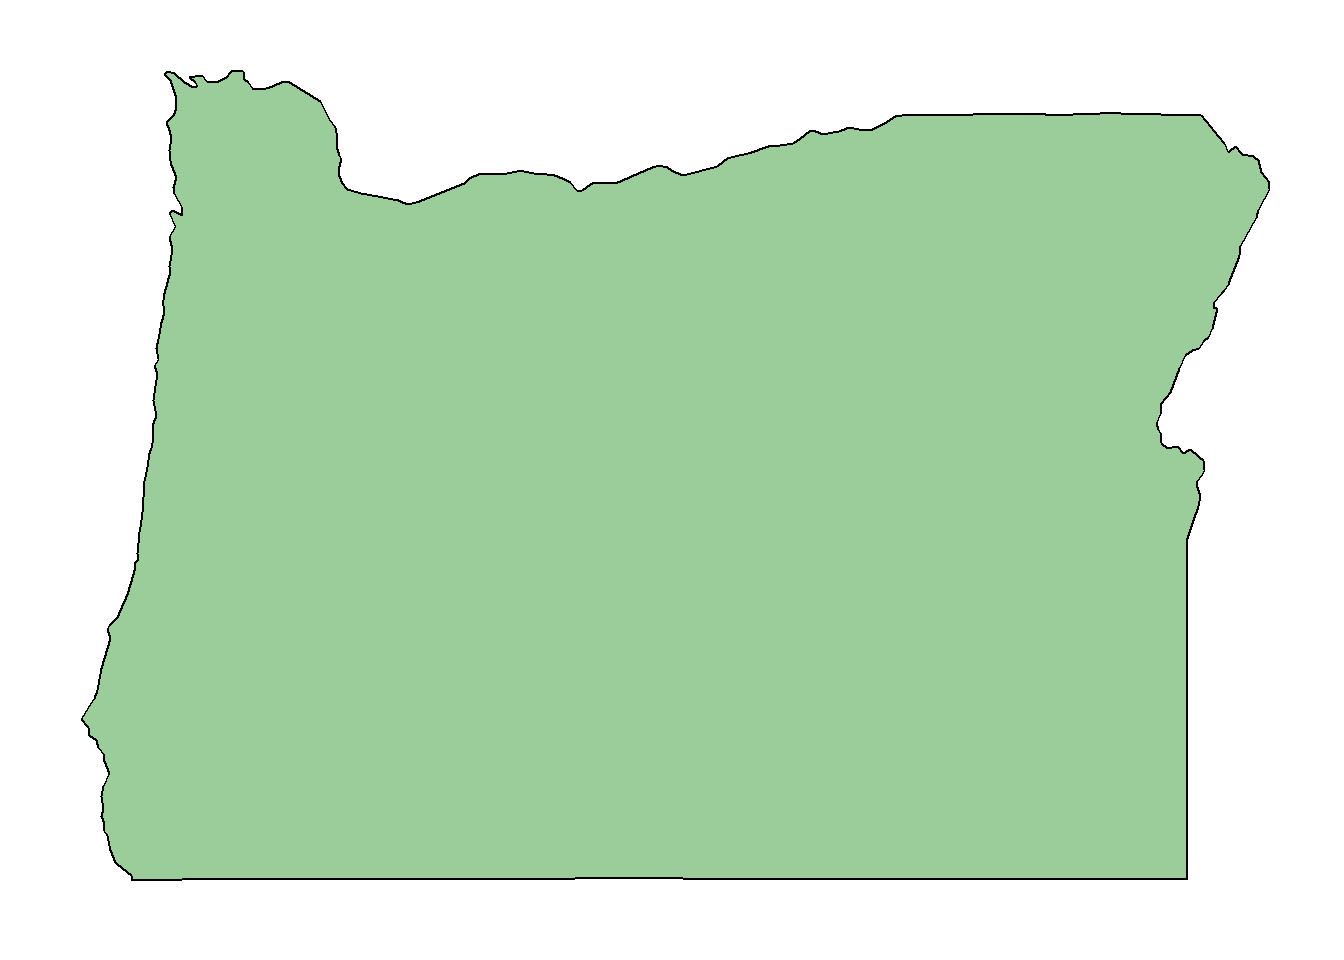
The plain_background_theme removes information that may not be needed.
You add the theme to the ggplot functions. In the following example, the map drawn in the previous chunk can be used. The plain_background_theme modifies the map to get the new map characteristics.
Show the code
## Add the theme to modify the previous map.OR_map + plain_background_theme
3.5 The island_map_theme
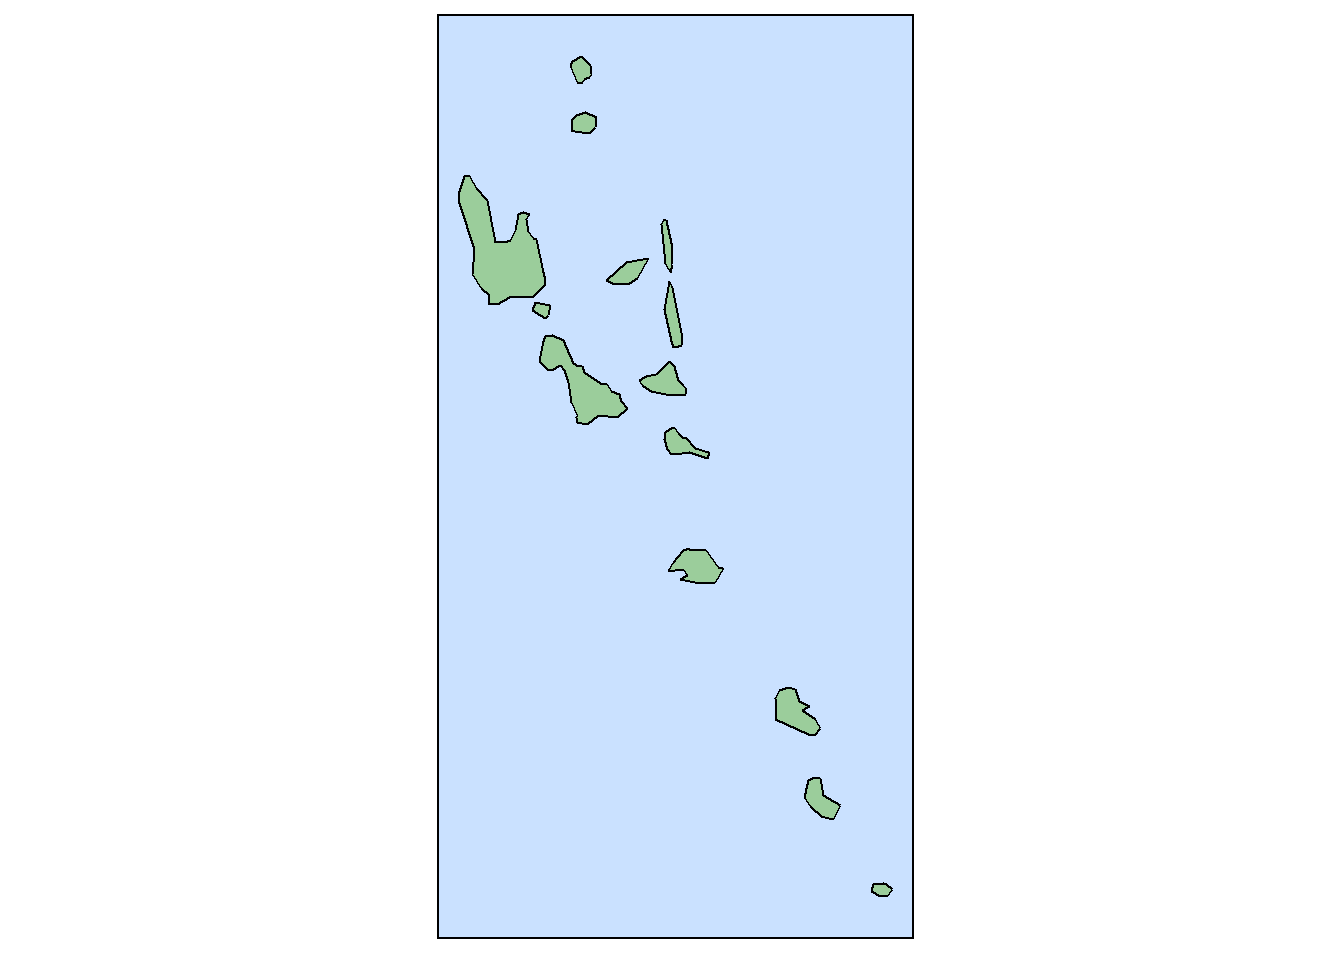
The island_map_theme is specialized for islands.
Unfortunately, Hawai`i is not included in the ggplot2 package using the map_data function (nor is Alaska). At this point, it is too soon to show you how this theme works for this state. However, we can show you an island nation. A package, usmap, provides a way to plot all fifty states with Alaska and Hawai`i placed in the bottom left corner.
The country maps can use a function, region_plot, that simplifies the process of creating the map. The theme is used with the mytheme parameter. This is shown in the following example.
Show the code
## Extract the Vanuatu border.vanuatu <-map_data("world", region ="Vanuatu")## Generate the plot using the region_plot function.vanuatu_map <-region_plot(region = vanuatu,coord =1.0, fill ="darkseagreen3",mytheme = island_map_theme)## Show the map.vanuatu_map