Google provides great maps. They are detailed and updated quite often. This mapping service provides an almost singular source needed for most routine mapping.
However, sometimes the Google maps provide too much information. In most cases you want a simple, uncluttered basemap. That’s a problem as Google provides maps with names of businesses, landmarks, street names, and more. Can you get rid of these unneeded (indeed, unwanted) information layers?
The answer is “yes.” For the most part, you can control what information appears on a Google map.
General Setup & Initialization
As usual, we’ll load the needed libraries. Then activate the Google Maps API key. This key provides access to Google Maps.
The key registration needs to be done only once for an RStudio session. This is why the process is kept in a separate R chunk so we don’t keep re-registering as we refine the maps.
Show the code chunk
## Librarieslibrary(readr) ## Read in datalibrary(ggmap) ## Show maps, handle Google keylibrary(ggplot2) ## Build mapslibrary(dplyr) ## Data wranglinglibrary(gt) ## Tableslibrary(sitemaps) ## Functions to help build mapslibrary(parzer) ## Convert HMS to digital coordinates## Initialize Google Map key; the is stored in a Project directory. My_Key <-read_file("P://Hot/Workflow/Workflow/keys/Google_Maps_API_Key.txt")## Test if Google Key is registeredif (!has_google_key()){## Register the Google Maps API Key.register_google(key = My_Key, account_type ="standard") } ## end Google Key test
Some useful code
There are a few bits of code that make it easier to build site maps. This section of code should be put at the start of any document so that the useful data values are available.
Show the code chunk
## Use two functions from mapfunctions to initialize parameterscolumn <-site_styles()hide <-site_google_hides()## Establish a theme that improves the appearance of a map## Define a theme that removes the axis labels and ## puts a border around the map. No legend.simple_black_box <-theme_void() +theme(panel.border =element_rect(color ="black", fill=NA, size=2),legend.position ="none")
Icon and Label Removal
Icon and label removal will be shown here using the ggmap’s get_googlemap function. Note that this is not how we’ll generally build maps, unless they are simply basemaps. Elsewhere you will see how to build basemaps using data locations and it will be easier to specify how the Google Map layers are suppressed.
Now, focus not so much on the code, but how Google Maps basemaps change as you remove information layers.
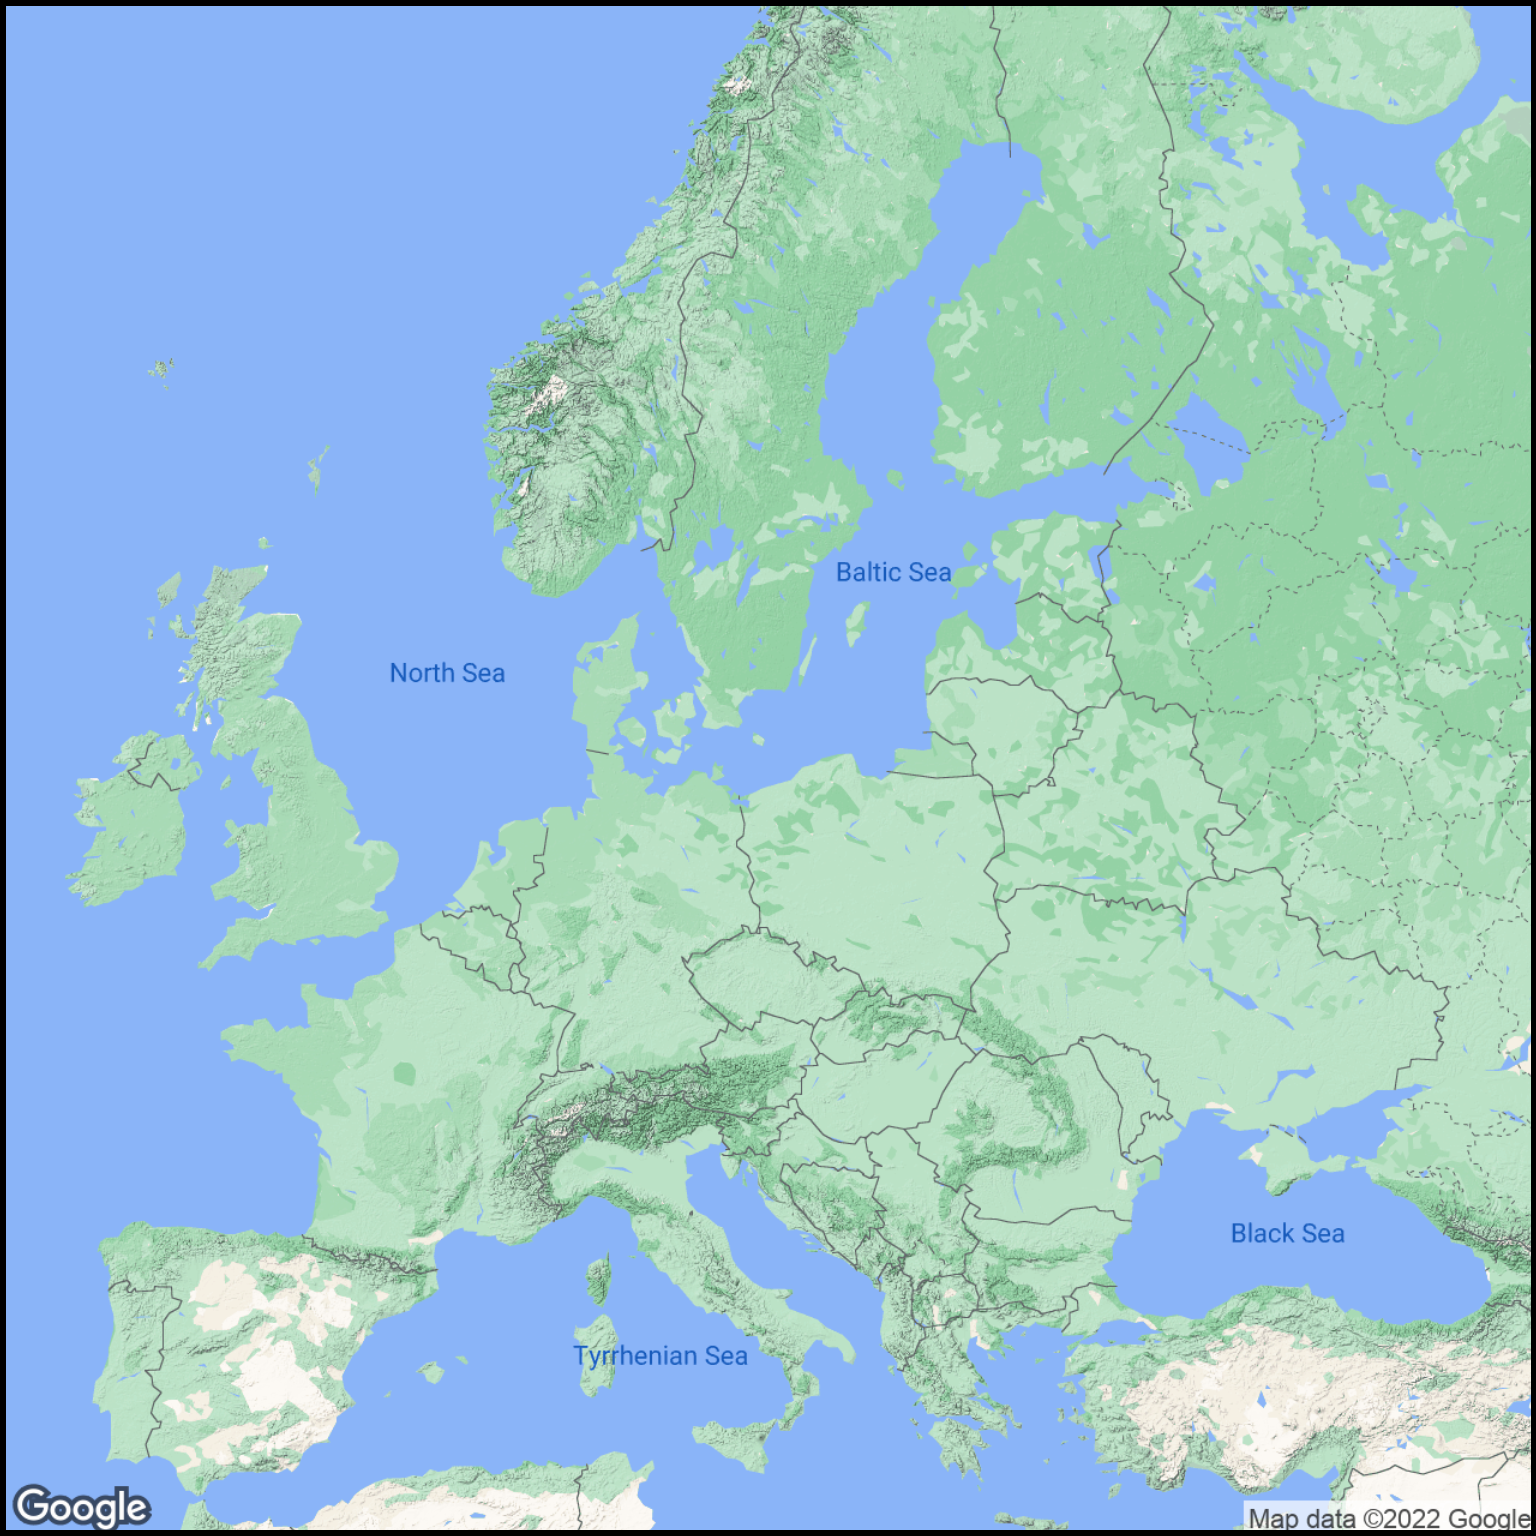
First, we’ll create a regional map without country names.
Show the code chunk
## Create a Google map.clean_map <-get_googlemap(center ="Europe", zoom =4,scale =2,style = hide$administrative)## Show the mapggmap(clean_map) + simple_black_box
Figure 1: Map of Europe with the country name layer removed.
This basemap (Figure 1) still has the names of major cities. These, along with all administrative (country, city, province and neighborhood) names can be hidden using a value stored as: hide$administrative.
?@tbl-hideparm a list of the style codes stored in the Useful Code chunk.
Show the code chunk
hide_parm <-read_csv(col_names =TRUE, file ="Parameter, Function hide$poi, 'Hide businesses, schools, park, emergency services, churches and similar points of interest.' hide$transit, 'Hide airports, transit lines and stops, bus and rail stops and stations' hide$water, Hide water bodies. hide$road, Hide highways and local roads. hide$andscape, Hide man-made and natural features. hide$administrative, 'Hide country, city, province and neighborhood names.' hide$all, Hide everything.")
?(caption)
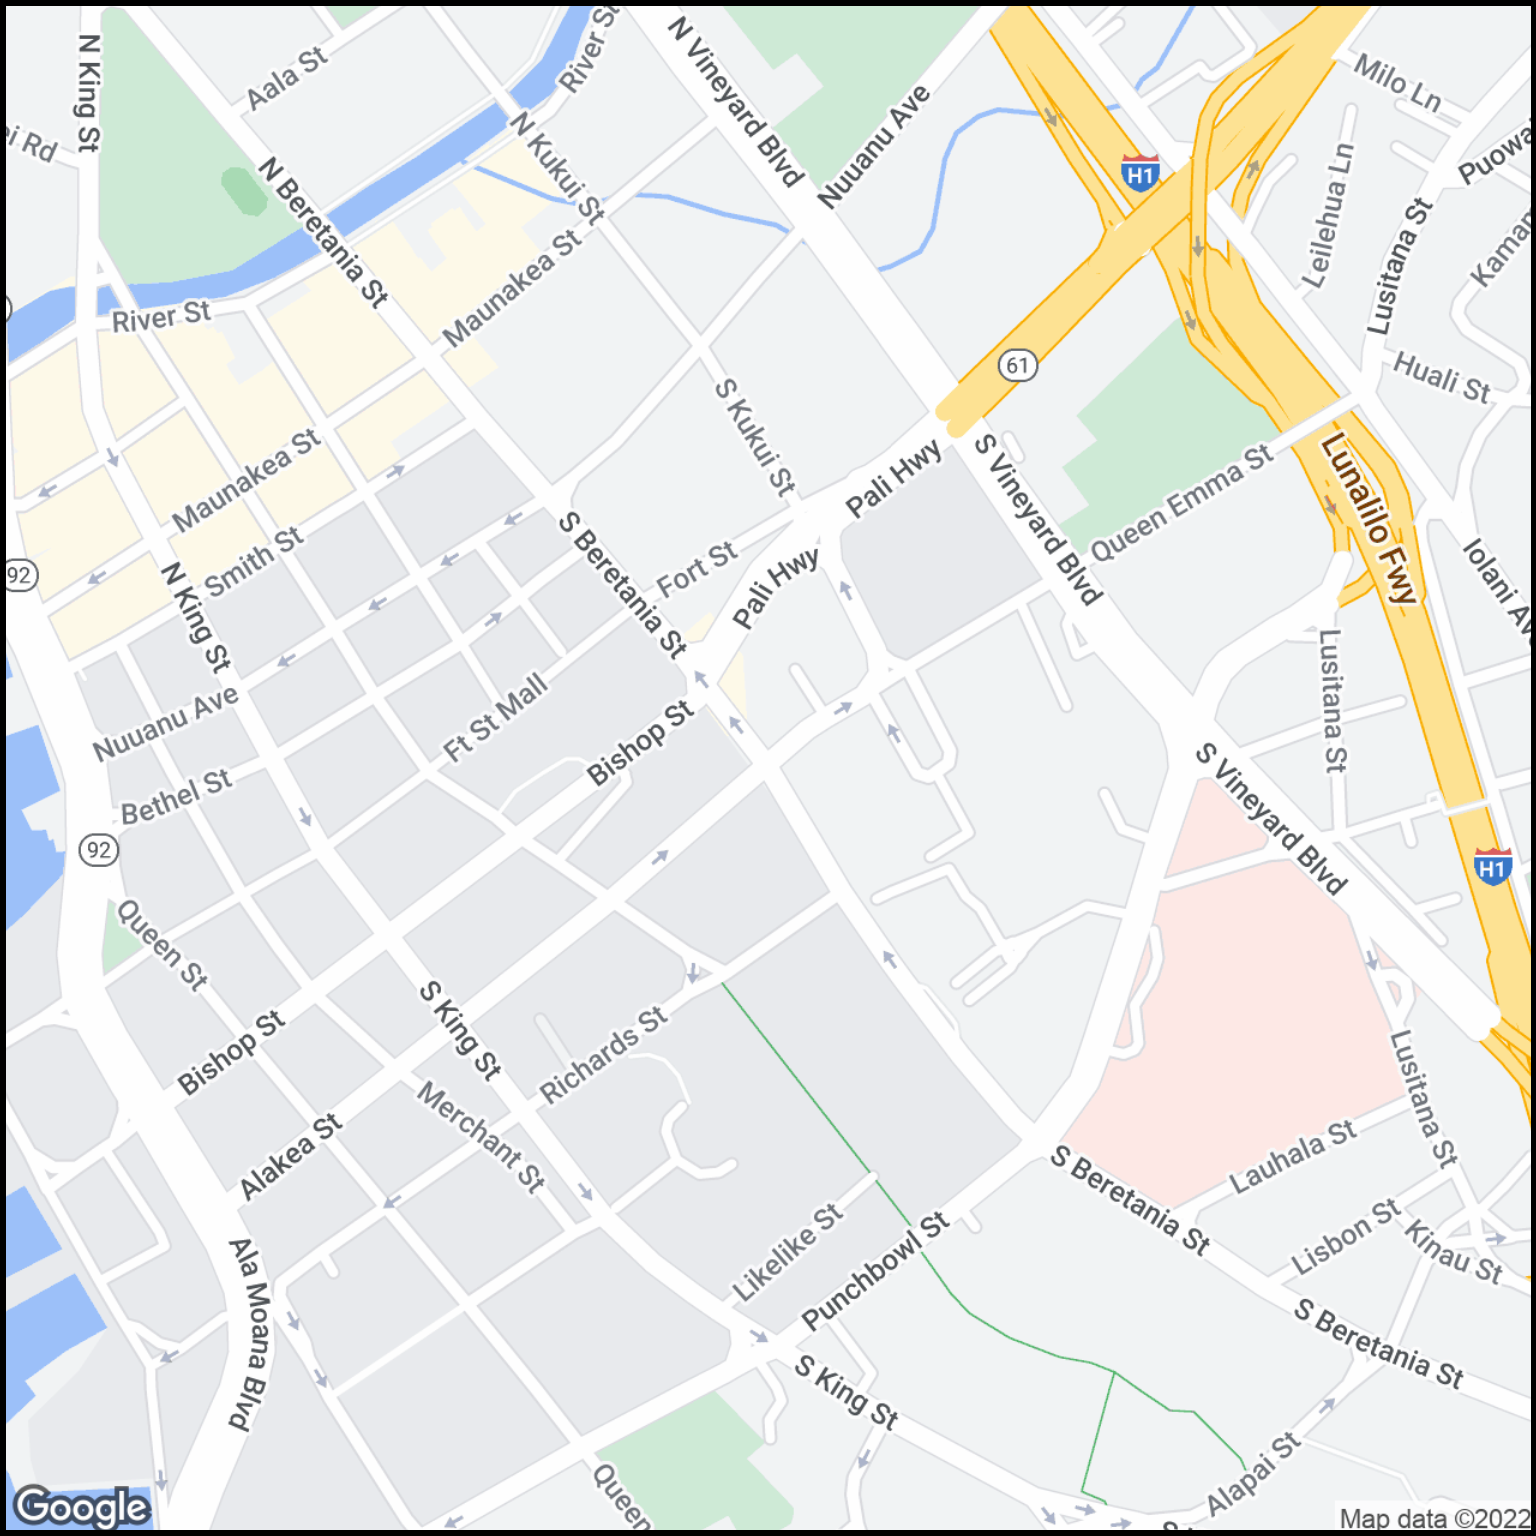
We can apply this same strategy to a city map to get it without business icons and names. At this scale, several dozen markers and labels are hidden, including restaurants, churches, government buildings and auto dealers. These “features” are known as “points of interest” (poi).
Basically, you can hide six different layers. Each layer has finer control. This was demonstrated earlier with the hide:country example where just the country names were hidden. Hiding an entire layer is what you’ll usually do. If you want finer control, check the reference above.
Remember that using the style information hides the icons and labels. If you use hide$road, for example, you still get roads drawn on several of the map types, but the roads are not labeled with an icon.
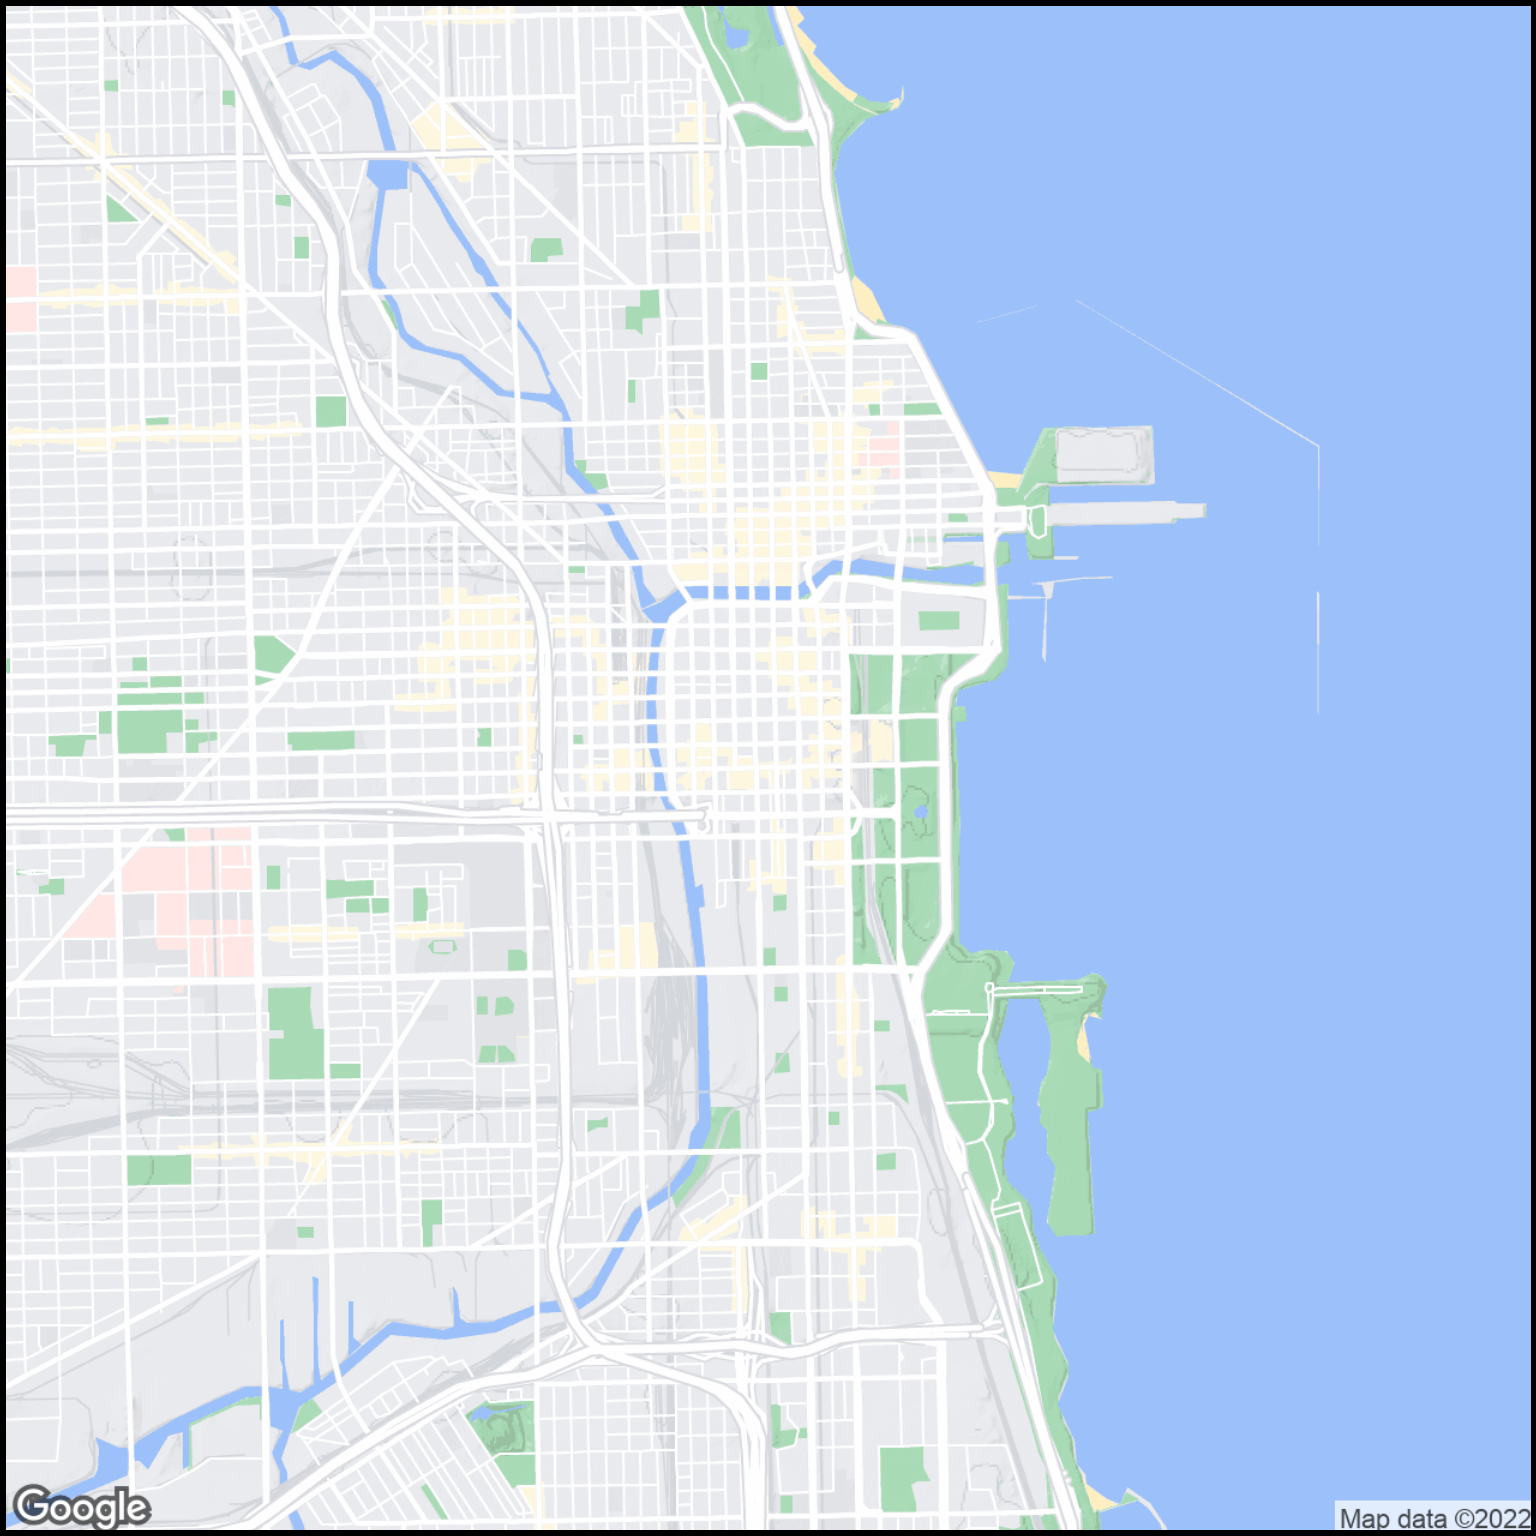
You can hide multiple layers. The following example (Figure 3) hides two layers (poi and transit).
Most often, you will probably use the hide$all to get a Google map free of icons and labels.